Charts
Create charts from your monday.com board and insert them into your report.
Insert charts into your report
Please note, that Charts are only available for the "board level", not for single item documents.
Insert placeholder for your chart
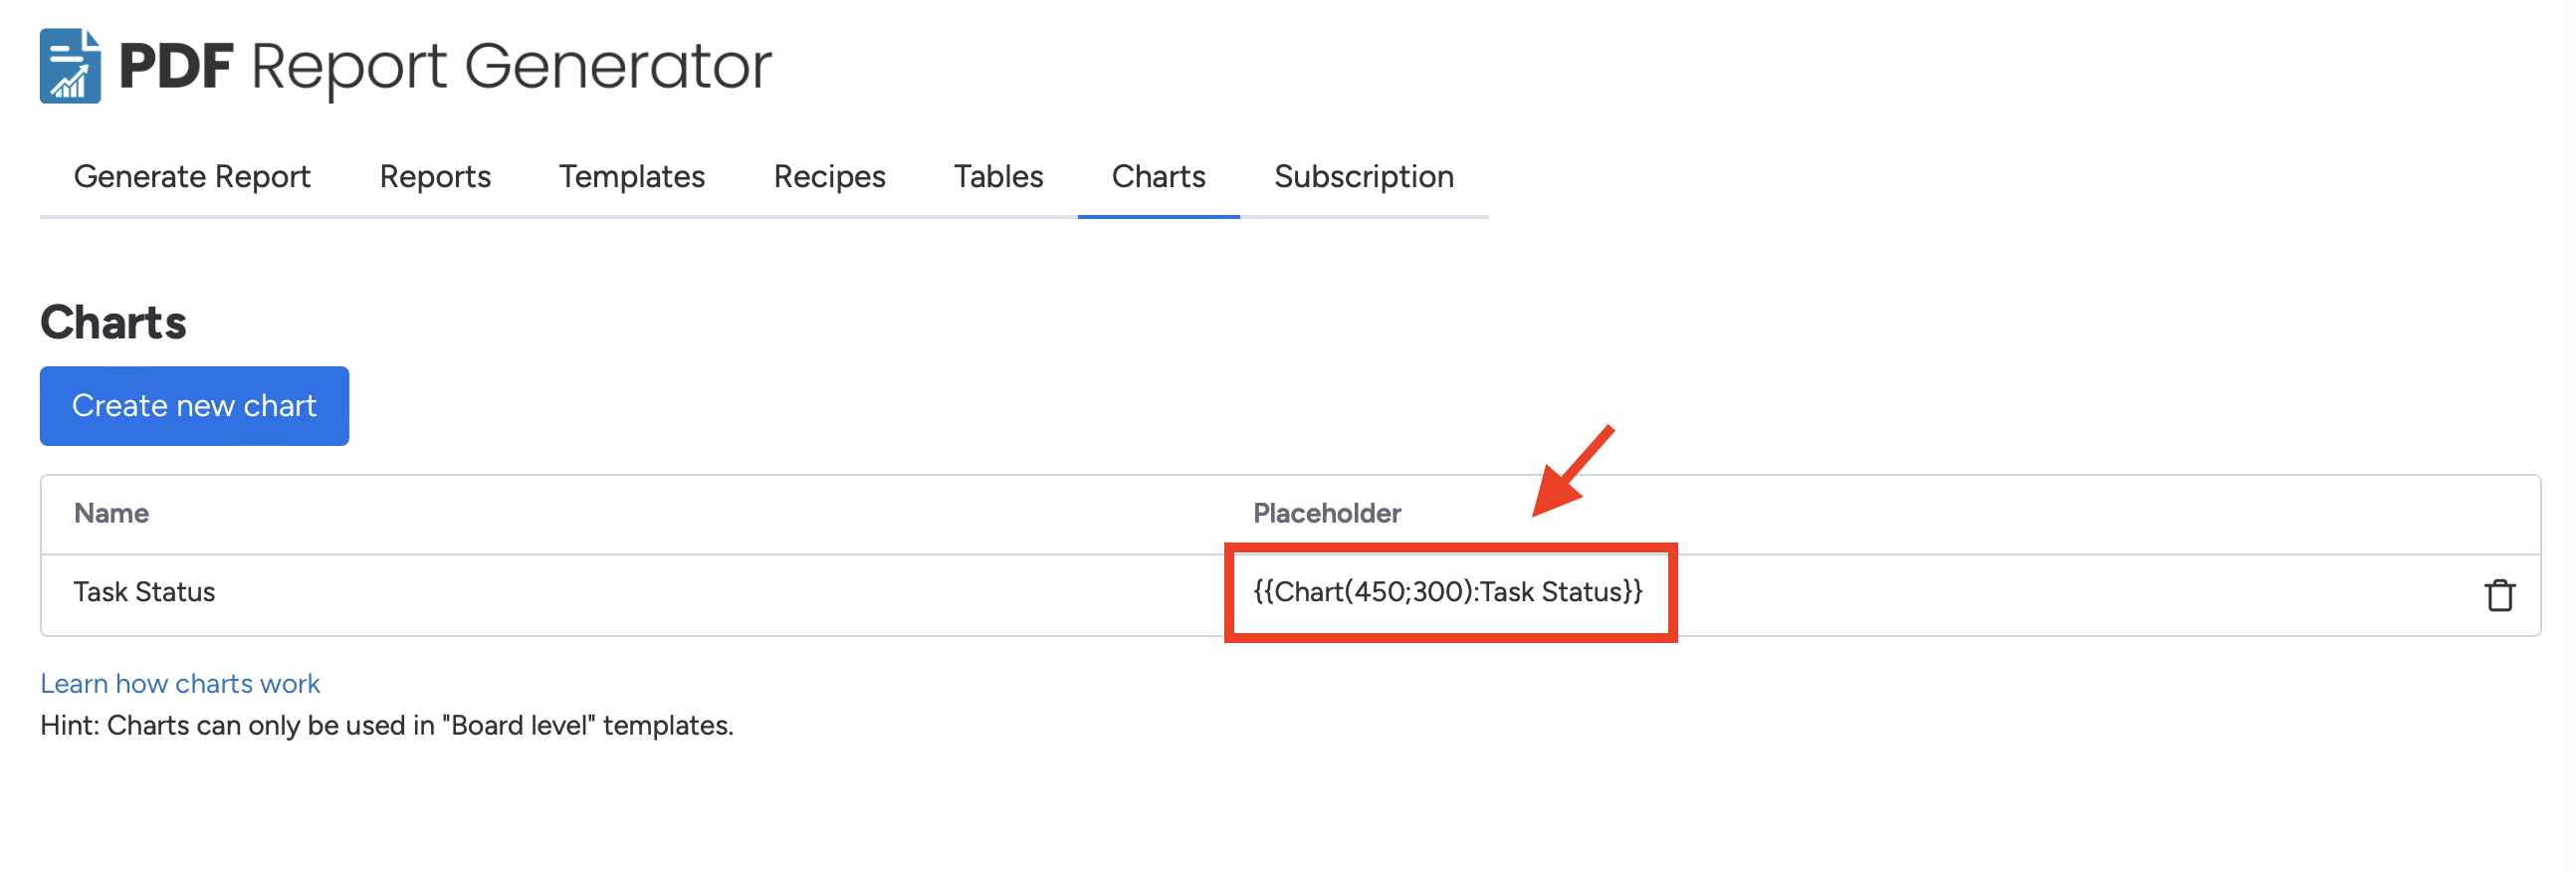
To keep it as simple as possible, we display the correct placeholder for your charts directly in the overview of your generated charts. You can simply copy and paste it into your Word document.
In general the placeholder looks like this:
Example:
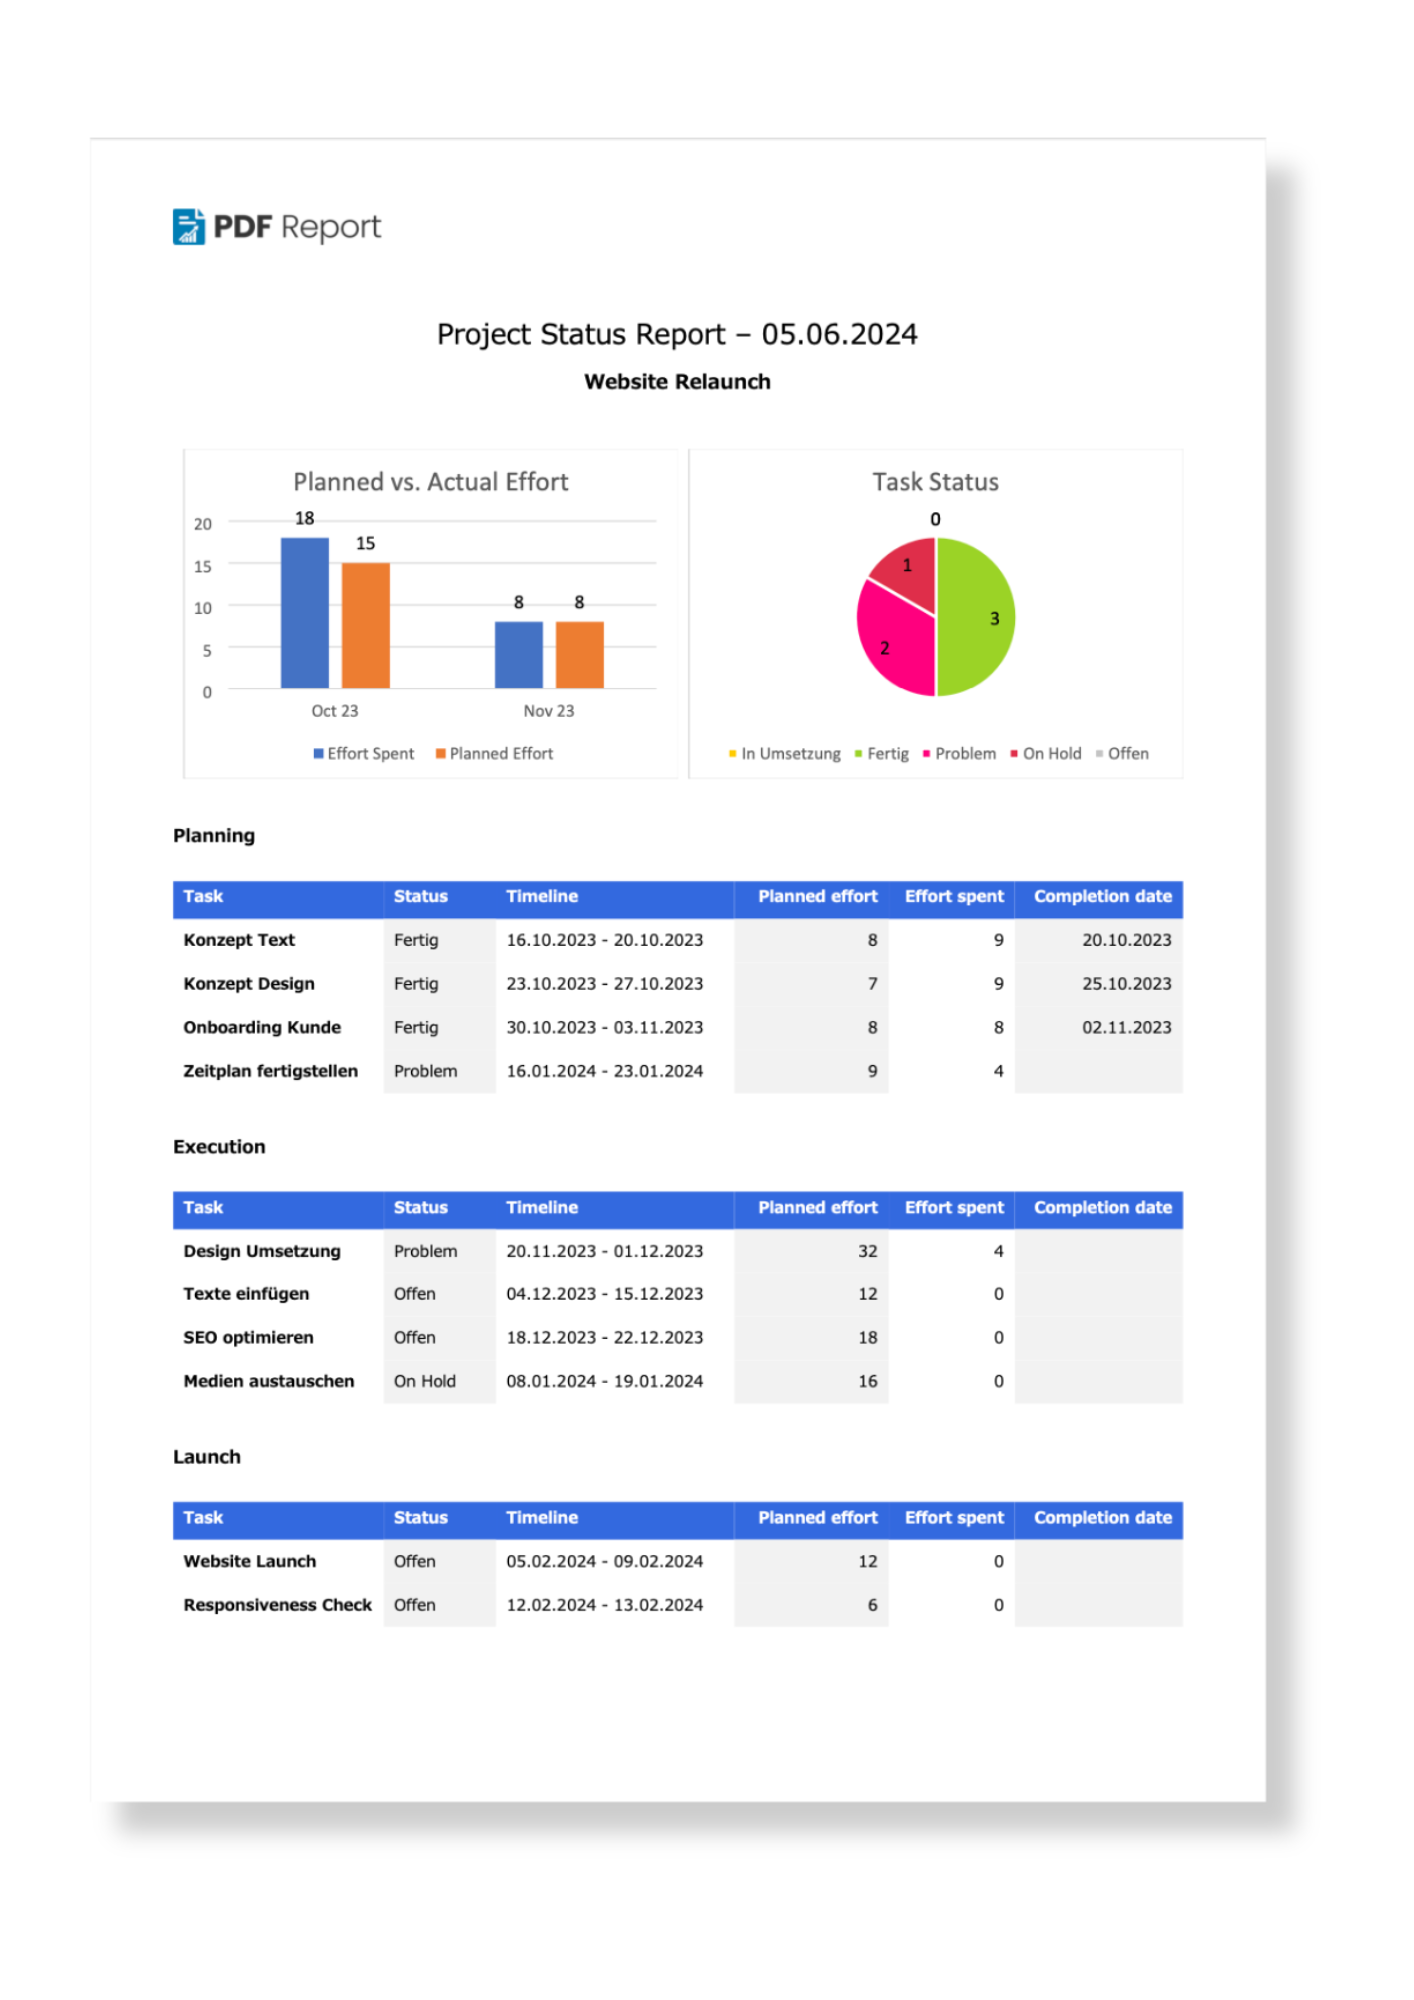
If your chart name is "Task Status", the placeholder would be {{Chart(450;300):Task Status}}
Change the size of your chart
We also suggest a size in the placeholder that we display. This is the number in brackets, e.g. (450;300).
But you can also define the size of the chart yourself. To do this, change the part in brackets after Chart:
{{Chart(450;300):Task Status}}
The "450" in the placeholder defines the image's width in pixels. The second value is the height.
Enter the size of the image in pixels here, separated by a semicolon.
If you change the {{Chart(450;300):Task Status}} to {{Chart(225;150):Task Status}}, it's half the size on the final report.
Add more than one chart
Of course you can add more than one chart to your report. Feel free to include as many charts and report statistics as you like. The only limit is you!